Exploratory Data Analysis of Bitcoin
Goal
Build a source of Bitcoin information to serve as an interesting introduction for people who have little knowledge of the system.
We present a number of views into the bitcoin ecosystem that visualize blockchain content, characteristics, transaction activity, global participation, price, and hoarding behavior.
Blockchain infographic
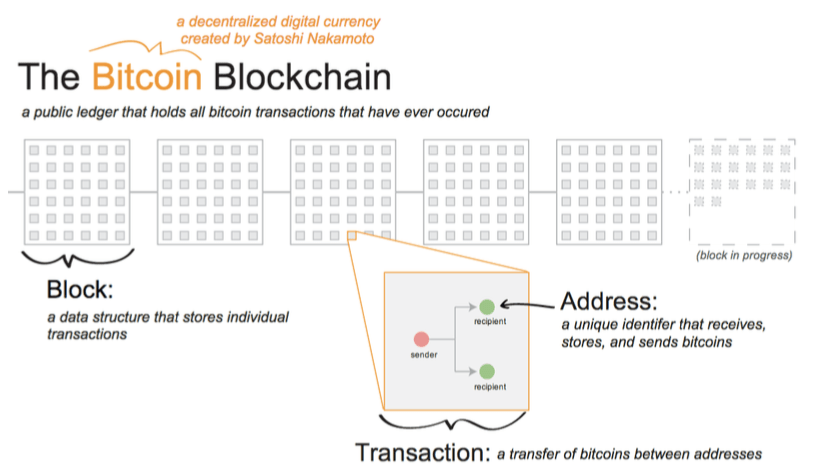
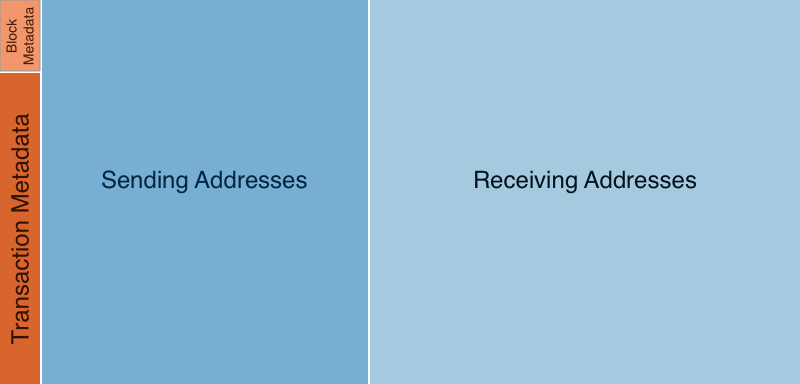
Block composition
A quick overview of what a typical block contains.
Sketching & brainstorming
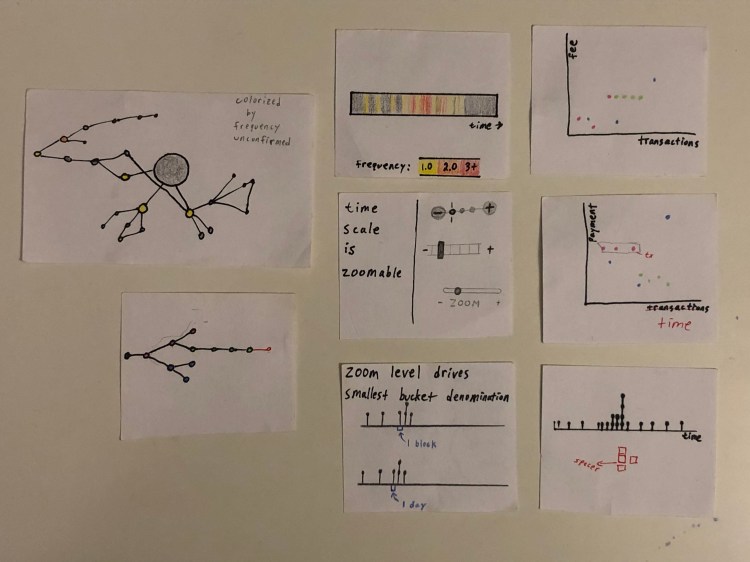
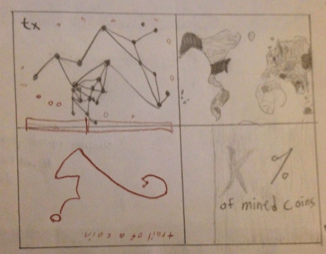
Transaction Views
Fun way of showing the participants of individual transactions. Shows the complex nature of many-to-many transactions that are possible with bitcoin
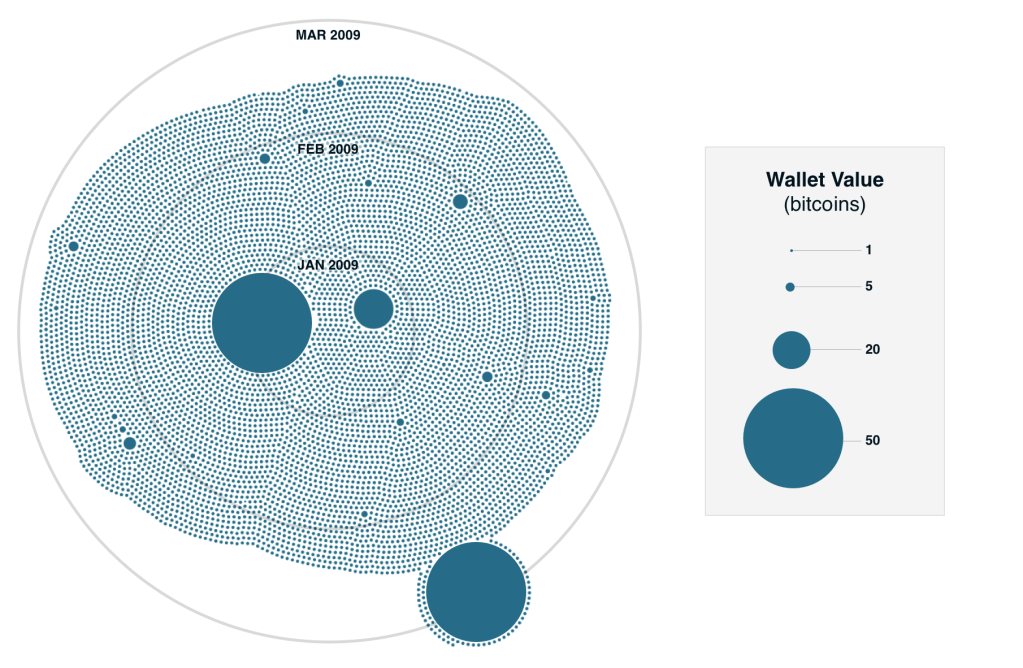
Early adopter wallets largely unchanged
First pass: This chart explored the amount and age of anonymous fortunes that have remained unchanged since the early days (first 3 months) of the bitcoin blockchain.
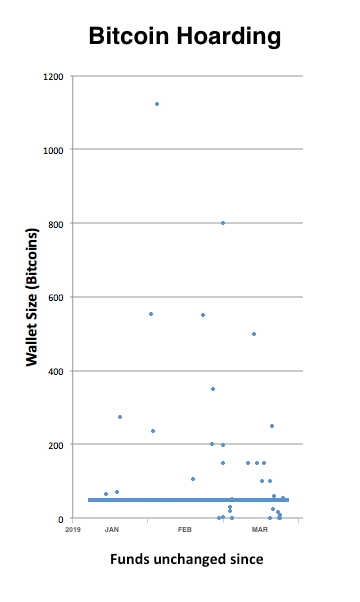
Second pass: User tests showed that the above chart left most viewers confused. To improve, we used a more traditional scatterplot and more specific labels.
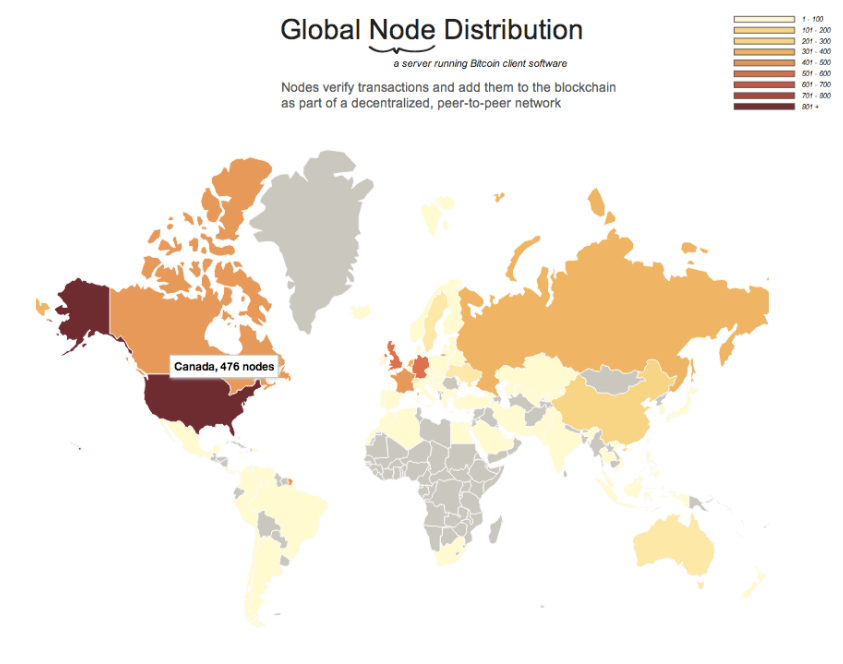
Node Distribution (point in time)
By mapping node location we can see geographically where bitcoin mining operations are located. Due to its decentralized design, broader distribution is better for the overall health of the network.
Live Demo
View Demo here (Mute speakers as some pages play dance music)
Tooling:
- Public APIs
- Blockchain.info: JSON and Websockets
- Blockcypher
- getaddr.bitnodes.io
- Javascript libraries
- Gephi and Pygexf
- Sigma.js
- d3.js
- Adobe Illustrator
- Sketch
- Excel
Data:
- Bitcoin wiki
- Live transaction feed
- Global distribution of the P2P network
- Address balances and transaction data pulled from bitcoin blockchain via custom python script
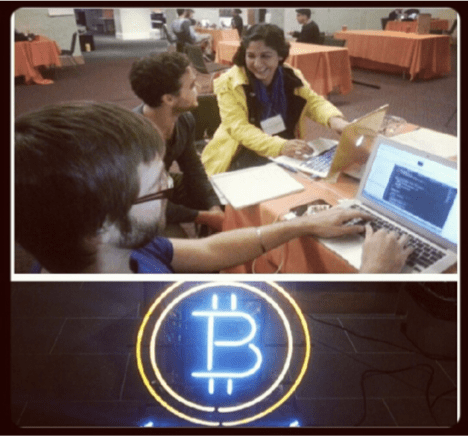
Team Coinviz wins hackathon!